Jumpstarting Open Performance Testing (with bonus Jakarta EE commentary)

This article is originally posted at the AdoptOpenJDK blog site and is modified slightly to mention some application/Microprofile testing plans.


Before I dabble in the juicy world of computer architectures and measuring and understanding performance implications, let me premise this entire post with a quick introduction to myself.

I am not a performance analyst, nor am I a low-level software developer trying to optimize algorithms to squeeze out the last ounce of performance on particular hardware.

While I am fortunate to work with people who have those skills, I myself am a ‘happy-go-lucky’ / high-level software developer.  My focus in the last few years has been developing my skills as a verification expert.  I have a particular interest in finding solutions that help testing software easier and more effective.  One flavour of software verification is performance testing.

While I am fairly new to performance benchmarking,  I am experienced in streamlining processes and tools to reduce the friction around common tasks.  If we want to empower developers to be able to benchmark and test the performance impact that their changes, we need to create tools and workflows that are dead easy.  I personally need it to be dead easy!  “Not only am I the hair club president, I am also a client“.   I want to be able to easily run performance benchmarks and at some level understand the results of those benchmarks.  This seems like a good time to segue to the recent open-sourcing of tools that help in that effort, PerfNext/TRSS and Bumblebench… a topic of my presentation entitled “Performance Testing for Everyone” at the upcoming EclipseCon Europe conference. 

If our work at the AdoptOpenJDK project proceeds as planned, I will be demonstrating the Test Results Summary Service (TRSS) and the PerfNext tool in October.  TRSS offers some compelling visual representations of test results such as graphical representations of daily builds of different benchmarks (as shown in a diagram below), and a comparison view.  This comparison view is most interesting, despite it being perhaps the most simple.  We do not just run performance tests at the project.  In fact, we have a great variety of tests (including regression, system and application tests) described in more detail in a previous blog post called “Testing Java: Help Me Count the Ways”.  Most test-related questions I field start with “how does that compare to…?”  What is the axis around which to compare?  There are many and they are layered.  Take any test, such as some of the Microprofile tests currently included in our “external tests” builds, and run those tests, but vary OpenJDK version or OpenJDK implementation.  If the test is a Jakarta EE compliance test (some of those fault tolerance APIs or metrics APIs TCKs we plan to add into our builds), compare against the Glassfish reference implementation, or across projects.  And what to compare?  The tests results themselves, but perhaps also the execution time or other implicit output.  Essentially, the tools we are creating, should allow for many lines of enquiry and comparison.

But returning back to the current story, a wonderful opportunity presented itself.   We have the great fortune at the AdoptOpenJDK project to work with many different teams, groups and sponsors.  Packet, a cloud provider of bare-metal servers, is one of our sponsors who donates machine time to the project allowing us to provide pre-built and tested OpenJDK binaries from build scripts and infrastructure.  They are very supportive of open-source projects, and recently offered us some time on one of their new Intel® Optane™ SSD servers (with their Skylake microarchitecture).

Packet and AdoptOpenJDK share the mutual goal of understanding how these machines affect Java™ Virtual Machine (JVM) performance.  Admittedly, I attempted to parse all of the information found in the Intel® 64 and IA-32 Architectures Optimization Manual, but needed some help. Skylake improves on the Haswell and Broadwell predecessors.  Luckily, Vijay Sundaresan, WAS and Runtimes Performance Architect, took the time to summarize some features of the Skylake architecture.  He outlined those features having the greatest impact on JVM performance and therefore are of great interest to JVM developers.  Among the improvements he listed :

  • Skylake’s 1.5X memory bandwidth, higher memory capacity at a lower cost per GB than DRAM and better memory resiliency
  • Skylake cache memory hierarchy is quite different to Broadwell, with one of the bigger changes being that it stopped being inclusive
  • Skylake also added AVX-512 (512 bytes vector operations) which is a 2X improvement over AVX-256 (256 bytes vector operations)

Knowing of those particular improvements and how a JVM implementation leverages them, we hoped to see a 10-20% improvement in per-core performance.  This would be in keeping with the Intel® published SPECjbb®2015 benchmark** (the de facto standard Java™ Server Benchmark) scores showing improvements in that range.

We were not disappointed.  We decided to run variants of the ODM benchmark.  This benchmark runs a Rules engine typically used for automating complex business decision automation, think analytics (compliance auditing for Banking or Insurance industries as a use case example).  Ultimately, the benchmark processes input files.  In one variant, a small set of 5 rules, in the other a much larger set of 300 rules was used.  The measurement tracks how many times a rule can be processed per second, in other words, it measures the throughput of the Rules engine with different kinds of rules as inputs.  This benchmark does a lot of String/Date/Integer heavy processing and comparison as those are common datatypes in the input files.  Based on an average of the benchmark runs that were run on the Packet machine, we saw a healthy improvement of 13% and 20% in the 2 scenarios used.

odmResultsSummary of ODM results

ODM_GraphODM results from PerfNext/TRSS graph view

We additionally ran some of our other tests used to verify AdoptOpenJDK builds on this machine to compare the execution times… We selected a variety of OpenJDK implementations (hotspot and openj9), and versions (openjdk8, openjdk9, and openjdk10), and are presenting a cross-section of them in the table below.  While some of the functional and regression tests were flat or saw modest gains, we saw impressive improvements in our load/system tests.  For background, some of these system tests create hundreds or thousands of threads, and loop through the particular tests thousands of times.  In the case of the sanity group of system tests, we went from a typical 1 hr execution time to 20 minutes, while the extended set of system tests saw an average 2.25 hr execution time drop to 34 minutes.

To put the system test example in perspective, and looking at our daily builds at AdoptOpenJDK, on the x86-64_linux platform, we have typically 3 OpenJDK versions x 2 OpenJDK implementations, plus a couple of other special builds under test, so 8 test runs x 3.25 hrs = 26 daily execution hours on our current machines.  If we switched over to the Intel® Optane™ machine on Packet, would drop to 7.2 daily execution hours.  A tremendous savings, allowing us to free up machine time for other types of testing, or increase the amount of system and load testing we do per build.

The implication?  For applications that behave like those system tests, (those that create lots of threads and iterate many times across sets of methods, including many GUI-based applications or servers that maintain a 1:1 thread to client ratio), there may be a compelling story to shift.

systemResultsSystem and functional test results and average execution times

Having this opportunity from Packet, has provided us a great impetus to forge into “open performance testing” story for OpenJDK implementations and some of our next steps at AdoptOpenJDK.  We have started to develop tools to improve our ability to run and analyze results.  We have begun to streamline and automate performance benchmarks into our CI pipelines.  We have options for bare-metal machines, which gives us isolation and therefore confidence that results are not contaminated by other services sharing machine resources.  Thanks to Beverly, Piyush, Lan and Awsaf for getting some of this initial testing going at AdoptOpenJDK.  While there is a lot more to do, I look forward to seeing how it will evolve and grow into a compelling story for the OpenJDK community.

Special thanks to Vijay, for taking the time to share with me some of his thoughtful insights and great knowledge!  He mentioned with respect to Intel Skylake, there are MANY other opportunities to explore and leverage including some of its memory technologies for Java™ heap object optimization, and some of the newer instructions for improved GC pause times.  We encourage more opportunities to experiment and investigate, and invite any and all collaborators to join us.  It is an exciting time for OpenJDK implementations, innovation happens in the open, with the help of great collaborators, wonderful partners and sponsors!

** SPECjbb®2015 is a registered trademark of the Standard Performance Evaluation Corporation (SPEC).
Advertisement
Jumpstarting Open Performance Testing (with bonus Jakarta EE commentary)

Testing Java: Let Me Count the Ways

For years now, I have been testing Java and if there is a single statement to make about that activity, it is that there are many, many, many ways to test a Java Virtual Machine (JVM).

From code reviews and static analysis, to unit and functional tests, through 3rd party application tests and various other large system tests, to stress/load/endurance tests and performance benchmarks, we have a giant set of tests, tools and test frameworks at our disposal.  Even the opcode testing in the Eclipse OMR project helps to test a JVM.  From those low-level tests, all the way up to running some Derby or solr/Lucene community tests, or Acme Air benchmark there are many ways to reveal defects.  If we can find them, we can fix them… (almost always a true statement).

One common request from developers is “make it easier for me to test”.  Over the last year, we have been working on that very request.  Recently, I’ve had the good fortune to become involved in the AdoptOpenJDK project.  Through that project, we have delivered a lightweight wrapper to loosely tie together the various tests and test frameworks that we use to test Java.

We currently run the set of regression tests from OpenJDK (nearly 6000 test cases).  Very soon, we will be enabling more functional and system-level tests at that project.

My goal with that project is to make it super easy to run, add, edit, exclude, triage, rerun and report on tests.  Some of the things involved in achieving that goal are:

  • create a common ways of working with tests (even if they use different frameworks, or focus on different layers in the software stack)
  • contain test code/infrastructure bloat
  • choose open-source tools and frameworks
  • keep technical ego in check when it rears up and wants to add complexity for little or no gain in functionality

There is a lot of work ahead, but so far, its been fun and challenging.  If you are interested in helping out on this grand adventure, please check out the project to see how to get involved at AdoptOpenJDK.

Testing Java: Let Me Count the Ways

‘Abra-cadaver’ and other magical spells for better testing…

A recent fun exercise has been to think about what is so magical about the way we test…

and in a typical campy fashion, I conjured up several incantations of the top list of things that we have done in order to evolve our testing to prepare it for the open.  It has been an interesting journey so far, trying to defend actions that I believe are absolutely necessary, to others who have not spent much time thinking about this topic.

More on this to follow, but here is a little teaser…  to cast this spell out upon the test code repository, ‘abra cadaver’, identifies the dead tests, those tests that continue to run, despite not having unearthed any new defect in years.  This spell renders all who would argue for keeping stale tests silent.  Let’s take a peek at this and many more spells and charms that can make a small test team a mighty force…

‘Abra-cadaver’ and other magical spells for better testing…

Fast, Low and Simple: Transitioning to Open-Source

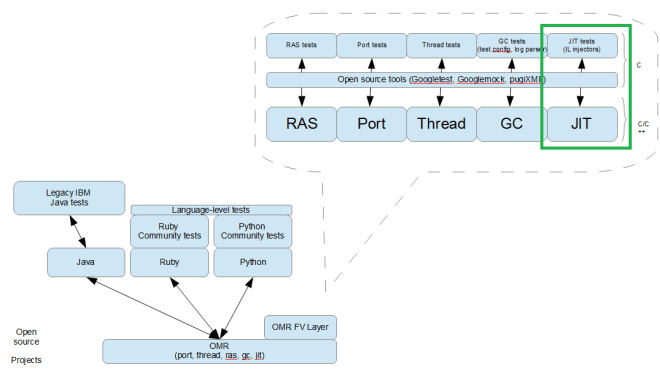
We test the Java Virtual Machine (JVM).  Recently some of our JVM product code has been pulled out into shareable runtime components (such as GC, JIT, RAS, Port and Thread libraries) to be used as building blocks for a multitude of other programming languages besides Java, such as Ruby, Python, Javascript (see Eclipse OMR for further details).  With this open-sourcing of some of our product code, we need to rethink, rebuild, and refactor our existing test approach.  Our new approach can be summarized by this mantra, “Fast, Low and Simple”.

Fast.  Tests in open-source communities are typically not run in isolated, pristine test labs.  Often they are run on a developers laptop.  This means our overnight suite of tens of thousands of tests are not suitable for sharing.  We want to design our tests to give us good functional coverage, with the minimal set of tests required.  Once the low-level APIs that required testing are identified, we apply combinatorial test design (CTD) principles to new API to keep test numbers low and test cycles short.

Low.  We can no longer rely solely on a massive set of Java tests written to exercise Java API, as this would not benefit the other language communities relying on the shared runtime components.  We need to push the tests down to the software layers below the languages that are built upon the runtime components.  By testing at this language-agnostic layer, we are able to avoid excess duplication and keep the length of the test runs short.

Simple.  We’d like our tests to be structured in a standardized way.  We should aim to reduce the number of tools required by the tests, and when we need them, look to use open-source tools rather than proprietary solutions.  By moving our tests to an open-source test framework, adhering to a coding standard for test source and using common approach for test output, we make tests much easier to maintain, triage and debug.

Let’s see our approach looks with an example.  We’ll drill down to find some of the simplest units to help test the Just In Time (JIT) component, the opcodes.  Why?  Because we want low and simple.  In computing, an opcode (abbreviated from operation code) is the portion of a machine language instruction that specifies the operation to be performed. Beside the opcode itself, instructions usually specify the data they will process, in form of operands.  If the behaviour of the opcode is incorrect, everything built on top of it may be incorrect.  So, for the OMR JIT component (Figure 1), we test the opcodes first, to catch any problems as low in the software stack as possible, to the root of a problem.

Figure 1: OMR JIT component

OMRLayer

Some opcodes are unary (only one operand), like the return opcode.  Some are binary, like add.  Some are even ternary.  If you break them out by data types, you get an opcodes explosion, iadd (adding 2 integers), ladd (adding 2 longs), etc.  There are hundreds of different opcodes.

In an upcoming post, we’ll dig into some details on how we modeled and tested these fundamental pieces.


Fast, Low and Simple: Transitioning to Open-Source

A Quick ‘n’ Dirty Intro to Combinatorial Test Design

Combinatorial Test Design (CTD) is a way to design a minimal set of tests that provide good/adequate functional coverage.  This is a brief overview of CTD to introduce the concept and describe how we are finding it useful for Functional Verification (FV).  It is an approach that can be applied at every level of testing, including system testing, but for the purpose of this guide, we will use FV examples.  When we test our products, we want good functional coverage of our source code.  Functional coverage does not mean the same thing as code coverage.  100% code coverage means that our tests exercised every line of the source code.  That sounds good, but it doesn’t mean much, if our tests are poor.  100% functional coverage means we exercise all lines of the source code with all possible variants or input values of the code.  To be clear, it is unrealistic to achieve 100% functional coverage and if we did, it would be too many tests to actually run and maintain.  CTD offers a better approach, one that brings us high functional coverage in as few tests as possible.

Let’s take a look at a simple example:

static Integer mathyJunkFunction(int num1, Integer num2, String num3) {

        return new Integer(num1) / (num2 + new Integer(num3));

}

If we test this function with the following:

Integer result = mathyJunkFunction(1, new Integer(1), “1”);

We will have 100% code coverage, but we will have not done a very good job of testing the function.  As you can see in this naive example, we see multiple defects that this test does not catch.

Defect 1: What if num3 has a value of  null (throws NumberFormatException)?

Defect 2: What if num3 is “1” and num2 is -1, or “0” and 0, or any other combination that sum to 0 (throws ArithmeticException)?

Defect 3: What if num2 is null (throws NullPointerException)?

This is a very simple example, that does not take into account implicit inputs or environmental factors that may affect the behaviour of real world source code, such as environment variables, command line options, platform specific behaviour or hardware configuration details.  In real world cases, we would also include any implicit inputs and their values.  Let’s ignore implicit inputs for our example.  The 3 parameters of the function are the explicit inputs we need to consider in our tests.  If we want to model the test space for this function, we need to look at the “values of interest” for each of them.  If our parameters were custom data structures or objects, we would need to provide the list of ‘equivalence classes’ as the values of interest.  In this example, we are dealing with known data types, so our job of defining ‘values of interest’ to use in our tests is easier.

num1 (integer): {MAX_VALUE, 1, 0, -1, MIN_VALUE}

num2 (Integer): {MAX_VALUE, 1, 0, -1, MIN_VALUE, null}

num3 (String): {“MAX_VALUE”, “1”, “0”, “-1”, “MIN_VALUE”, null}

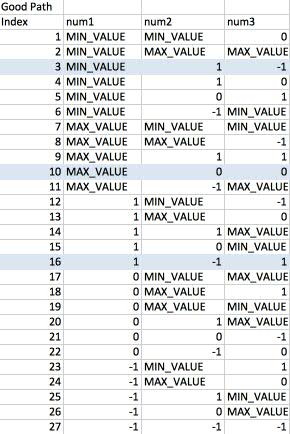
If we tested all combinations of all values of the 3 inputs (100% functional coverage), we would have 5 x 6 x 6 = 180 test cases.  But as many studies of typical source code have shown, most defects are caused by faulty logic involving 1 input or the interaction of 2 inputs.  Because of this, we know that if we apply limits, creating a test case for every pair of values (known as pairwise testing), we will typically have 80+% functional coverage (unless the code under test is atypical of most source code).  When we take every unique combination of value pairs, we arrive at 29 test cases (27 good path, 2 bad path) as shown in Table 1 and 2.

Table 1: Pairwise testing for mathyJunkFunction() – Good Path

goodPath-1

Table 2: Pairwise testing for mathyJunkFunction() – Bad Path

badPath-1

29 test cases are more manageable than 180.  When we look at the list of test cases, we see that for the 3 defects we flagged in our naive example,

Test Case 1 of the Bad Path list (in Table 2) would catch Defect 1 (the NumberFormatException)

Test Case 2 of the Bad Path list would catch Defect 3 (the NullPointerException)

Test Cases 3, 10, 16 catch Defect 2 (the ArithmeticException)

With inspection of the source code, we could decide to reduce our test case numbers even further, but if we were testing something more complex, or were black box testing, we could implement the set as described and have confidence that we would catch the majority of defects.  We have applied CTD to a lot of the FV in the OMR Eclipse project and designs relating to other 2015 feature requests.  Our plan is to enhance our understanding and use of CTD in 2016 including some automation experiments and to continue to see the many benefits from our efforts.

A Quick ‘n’ Dirty Intro to Combinatorial Test Design

Upgrading old customized unit tests to TestNG

We maintain a LOT of old tests written in several ‘almost’ JUnit3-like formats (just shy of 540,000 lines of test code).  You see, these tests were written long enough ago, that they did not benefit from some of the features of modern day test frameworks.  Developers would either write their own, or extend JUnit3’s TestCase class to add some additional stuff, because they could, they probably needed to, and because it was the wild west.  No coding standard applied to test code, it was considered different than product code.  Now we know this approach is sub-optimal.  But back in the wild west days, anything went…

Luckily some of what we need to convert can still be done with the Eclipse TestNG plugin.  Some however, will have to be carefully hand-converted…  Yuck!  We are hoping the end result will be worth it though, to be able to take advantage of many of the existing and future features of TestNG.

My shout-outs…  Yeah to user-defined groups!  Yeah to flexibly including or excluding tests directly with annotations in test source code!  We did some of this in our own proprietary ways, but now can standardize the approach.  Yeah to some form of modernization of our test base, and though it will be some effort, it affords us the opportunity to reconsider and cull unnecessary tests, rework and improve some of our test output, and read and understand some legacy test code that we didn’t write, but need to be able to maintain.

At this point, I remain optimistic.  Ask me again how I feel after a few hundred thousand lines of code are scoured and upgraded.

Upgrading old customized unit tests to TestNG

Reconciling Simplicity with Flexibility

As we review the tools and processes we use to manage the large build and test system for our Java products, one observation stands out.  We want things to be simple, but over the course of a decade, more and more custom tooling was written to make the builds more flexible.  A gnarly tangle of scripts sits taunting us…  “just try and fix us”.

Captain’s log:

As we embark on the journey to simplify, heading into uncharted territory, full of trepidation, a solemn quiet settles over us…  if we can’t make it simple to test our products, we will perish.

Most definitely an over dramatization of our 2016 goals, but a fun way to think about the work…  do or die.  Instead of “fixing” the gnarly scripts, opt to throw them away altogether.  Throw out some popular convenience features and tools in the process, because to keep them as they are means continued high maintenance costs in the future.  We will come at the problem by stripping away everything and then adding in necessities.  The claim is that it is far better to have simplicity (builds that anyone can run, tests that everyone can triage and re-run, etc), than have flexibility that only benefits a small portion of the team.


Reconciling Simplicity with Flexibility